Token God Mode 101
Token God Mode is a comprehensive view for diving into a token in detail. From tracking Smart Money movements to analyzing holder distributions and exchange flows, this powerful tool gives you a complete view of any token's activity.
Written By Nansen Team
Last updated Over 1 year ago
Token God Mode Overview
On Tokens Dashboard, you can analyse any token on Nansen by just hitting Token God Mode, getting a macro perspective on your token of choice. Includes information on exchange balances, top balance changes, top transactions, token distribution and recent trades.
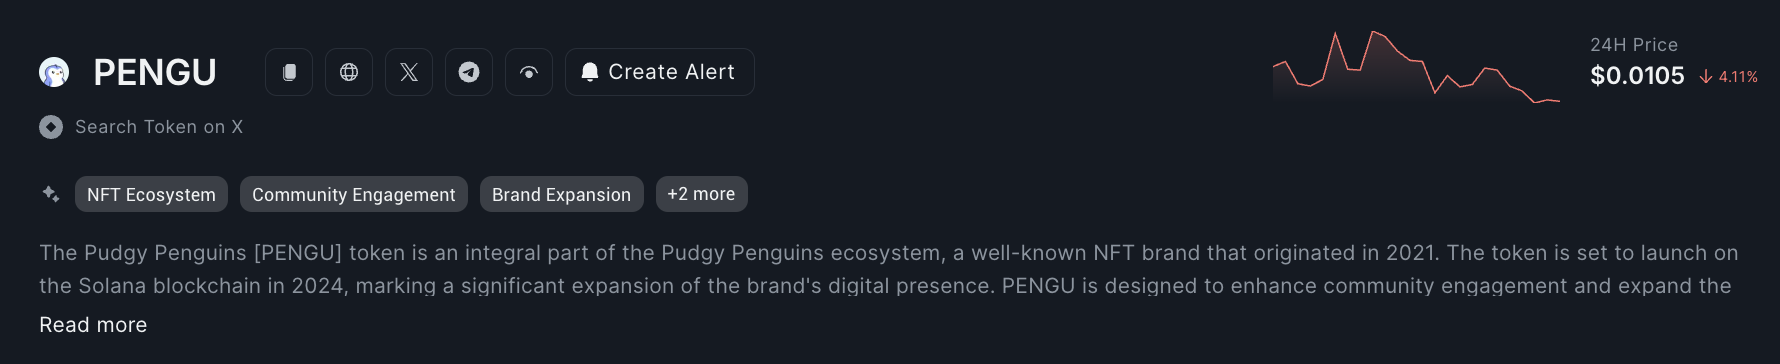
Token Overview - See an overview of what the token is, with links that point directly to the team’s social media handle, website, Telegram, as well as searching the token on X to see what people are talking about
Who Bought? - See a list of the largest DEX buyers/sellers of the specific token, sorted by volume over the specified timeframe. This excludes inflows/outflows from CEXs or other addresses. Price fluctuations within the selected timeframe can result in a negative net $ volume even for net positive token amounts.
DEX Trades - View a Live feed of the latest DEX trades for the specified token.
Jupiter DCA Orders - View a list of Dollar Cost Averaging (DCA) orders created through Jupiter
Top Transfers - View a list of the top transfers of the specified token, sorted by token amount.
Viewing Token Balances
Get a detailed breakdown of the top addresses/entities holding a specified token, sorted by amount held.
Distribution - A daily breakdown of the amount of tokens held by the top 5 addresses. Switching to 'Top Balances' offers a daily breakdown of the percentage of tokens held by various categories of entities.
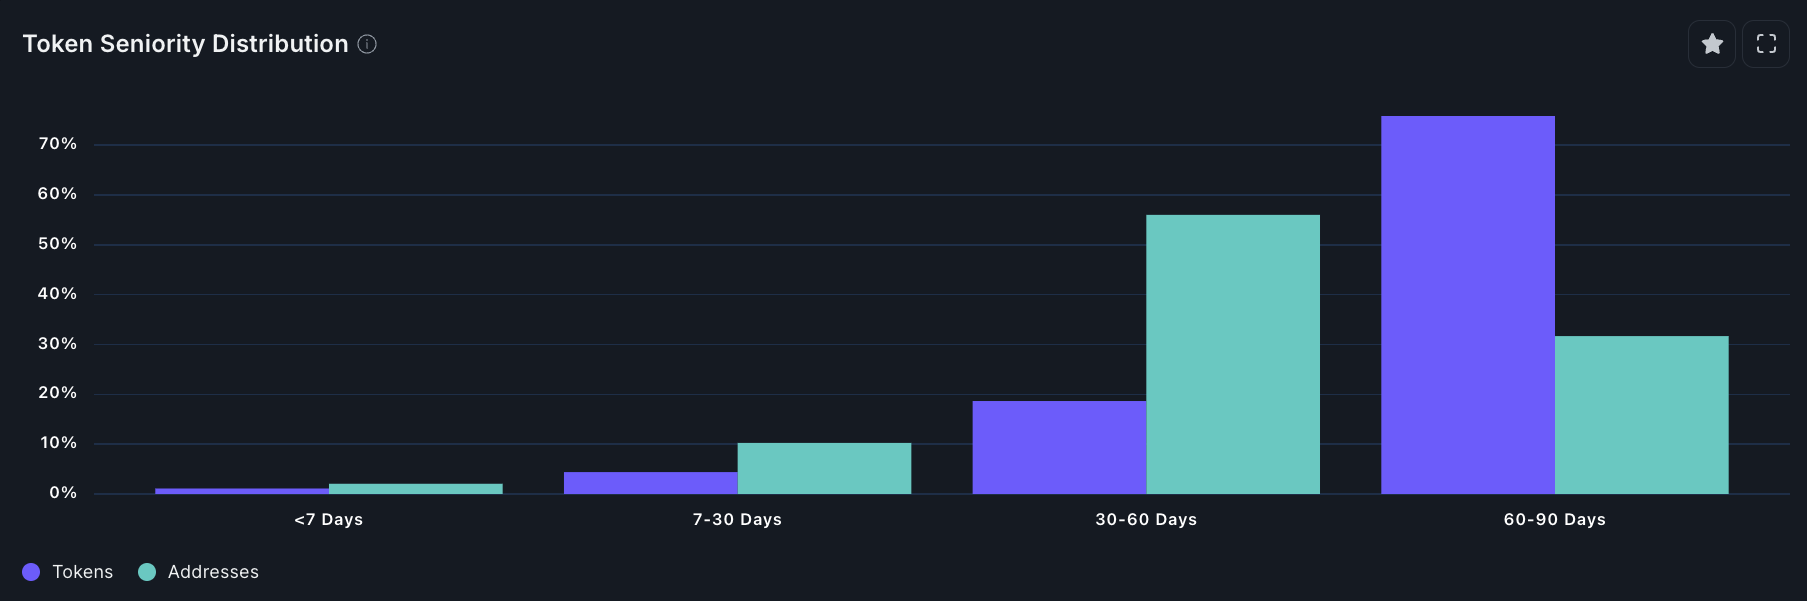
Token Seniority Distribution - A breakdown of the current holding duration of all addresses, segmented by timeframes.
Token on Exchanges
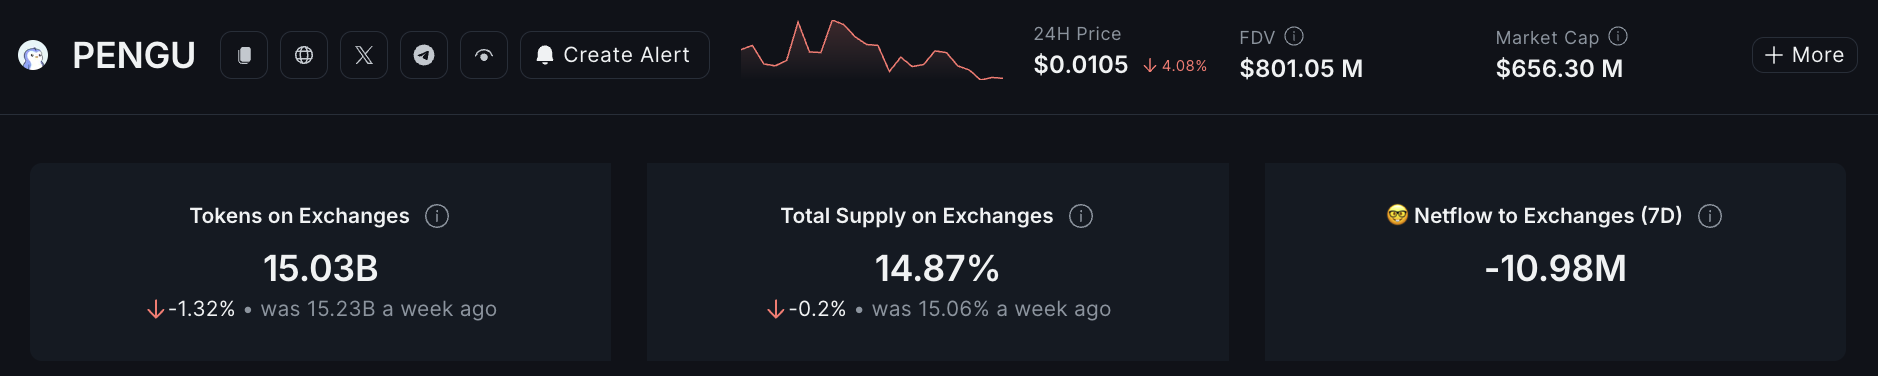
Token Exchanges - Aggregated token balance across all exchanges
Total Supply on Exchanges - An aggregated token balance across all exchanges as a fraction of total supply.
Smart Money Netflow to Exchanges - Total tokens smart money has deposited in the last 7 days, if it's negative it means withdrawals dominate deposits.
Top Exchanges - A list of exchange balances of the specified token and the changes to their holdings over the last 7 days, sorted by the amount of tokens held
Exchange Flows - A daily breakdown of the volume of inflows/outflows of the specified token from exchanges. Switching to 'Depositors/Withdrawers' shows a daily breakdown of the number of addresses depositing/withdrawing.
Top Deposits/Withdrawals - Track all the deposits and withdrawals made for that token for a given time frame.
Top Exchange Depositors/Withdrawers - Track all the exchange depositors and withdrawers made for that token for a given time frame.
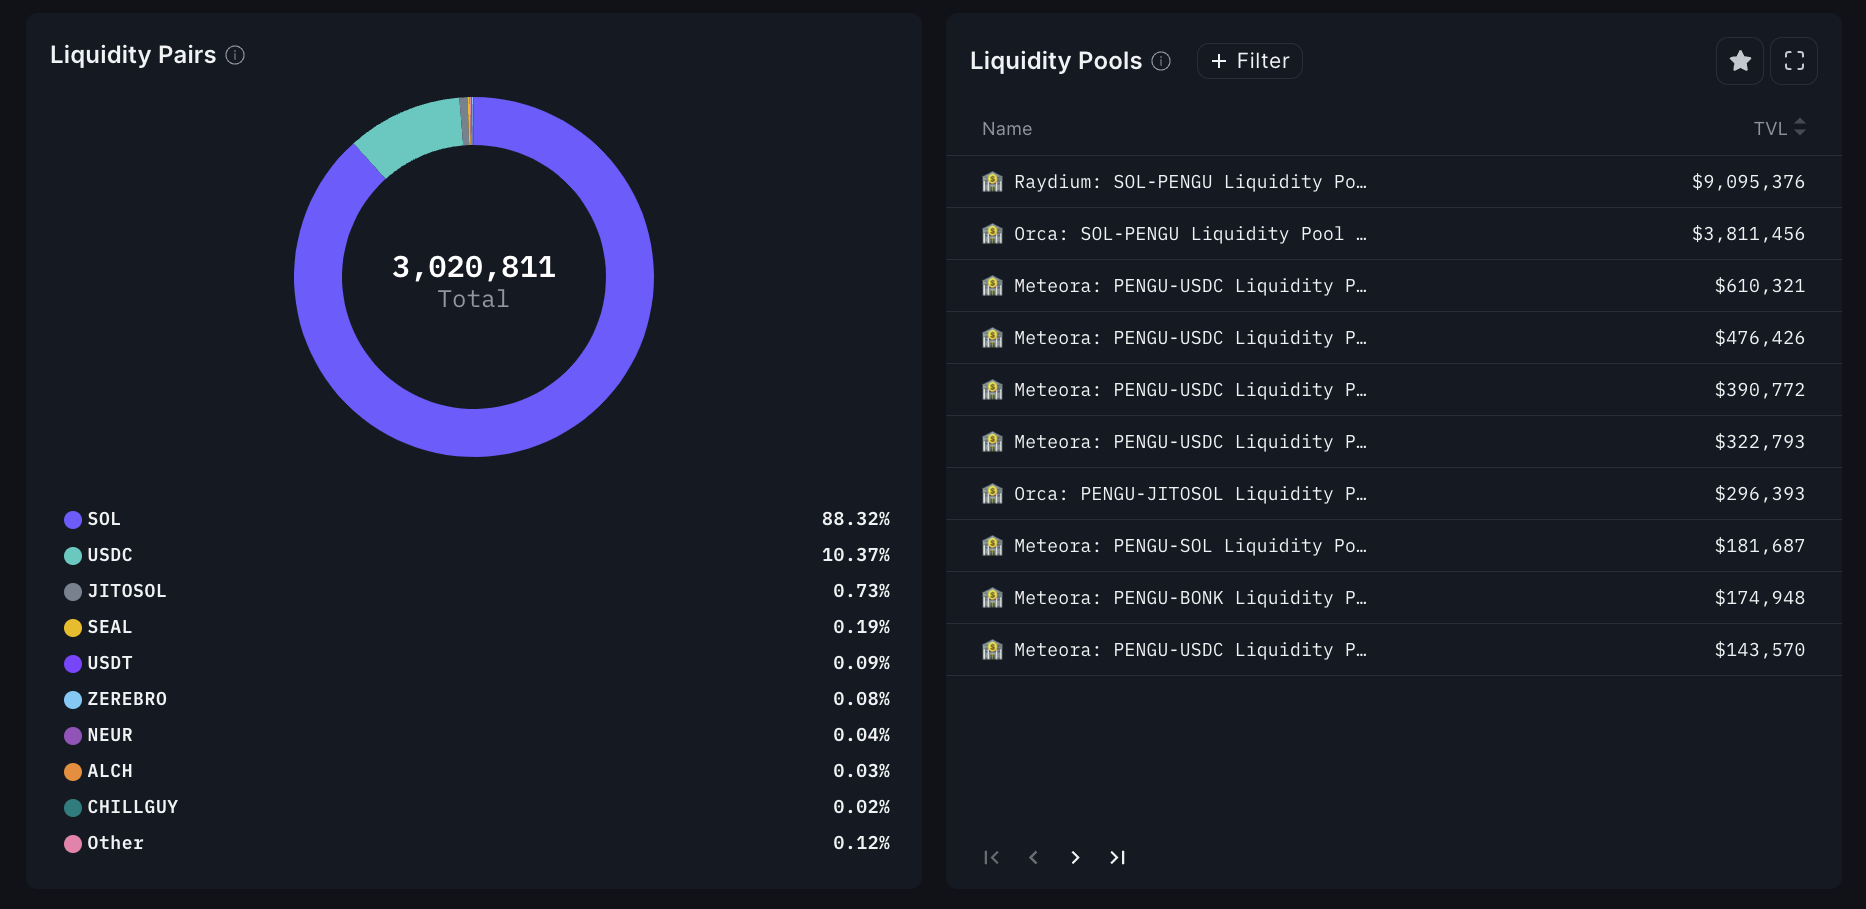
Liquidity Pairs - Get an overview of the amount of liquidity the specified token has across DEXs on Ethereum, with a breakdown of each liquidity pair.
Liquidity Pools - Get a detailed list of all the liquidity pools for the specified token.
Smart Money Activity on Token
View the selected token’s holdings and transfers across 24h, 7d, 30d, digging deeper into the given addresses for more information.
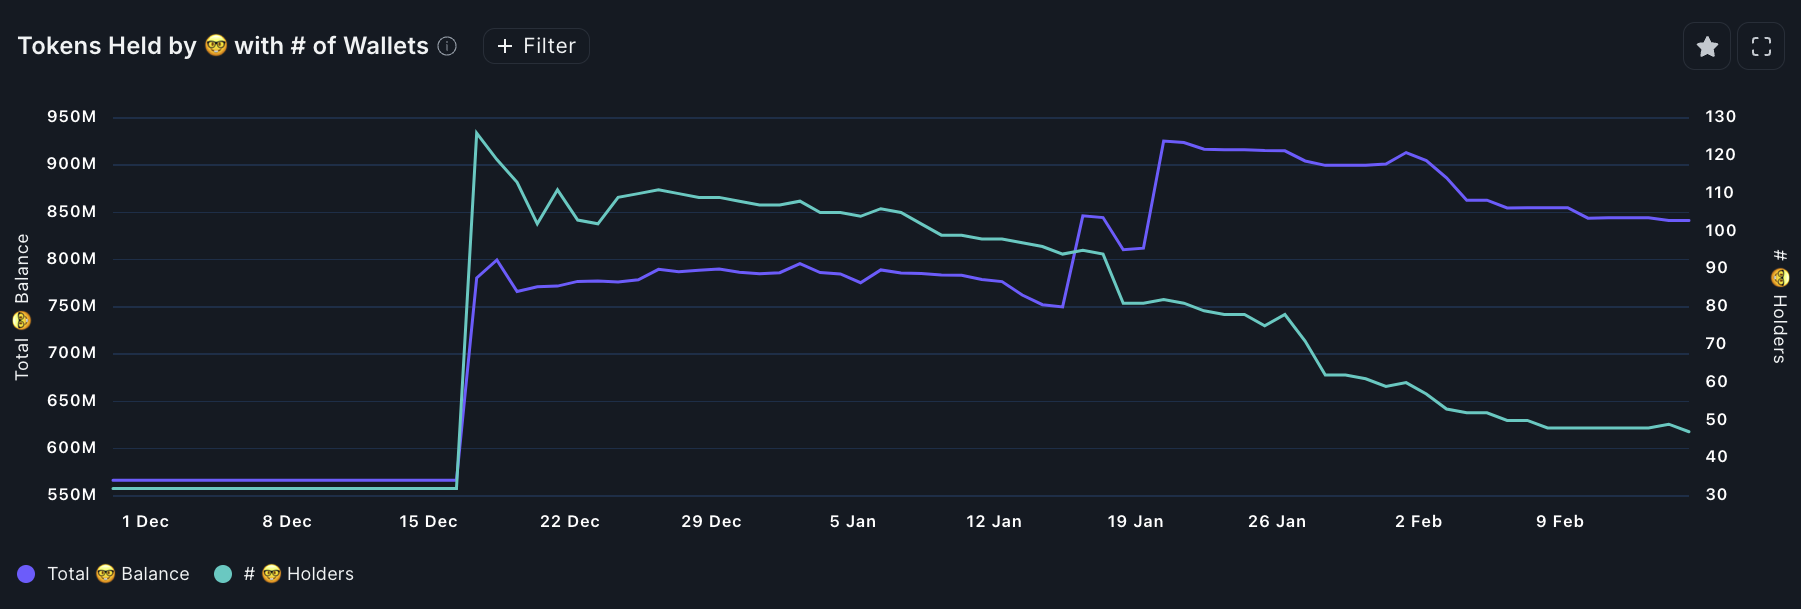
Tokens Held by Smart Money with # of Wallets - This chart shows the historical balance of Smart Money along with the # of holders. A balance of > $100 is required to be considered a Smart Money holder.
PnL Leaderboard for the Token
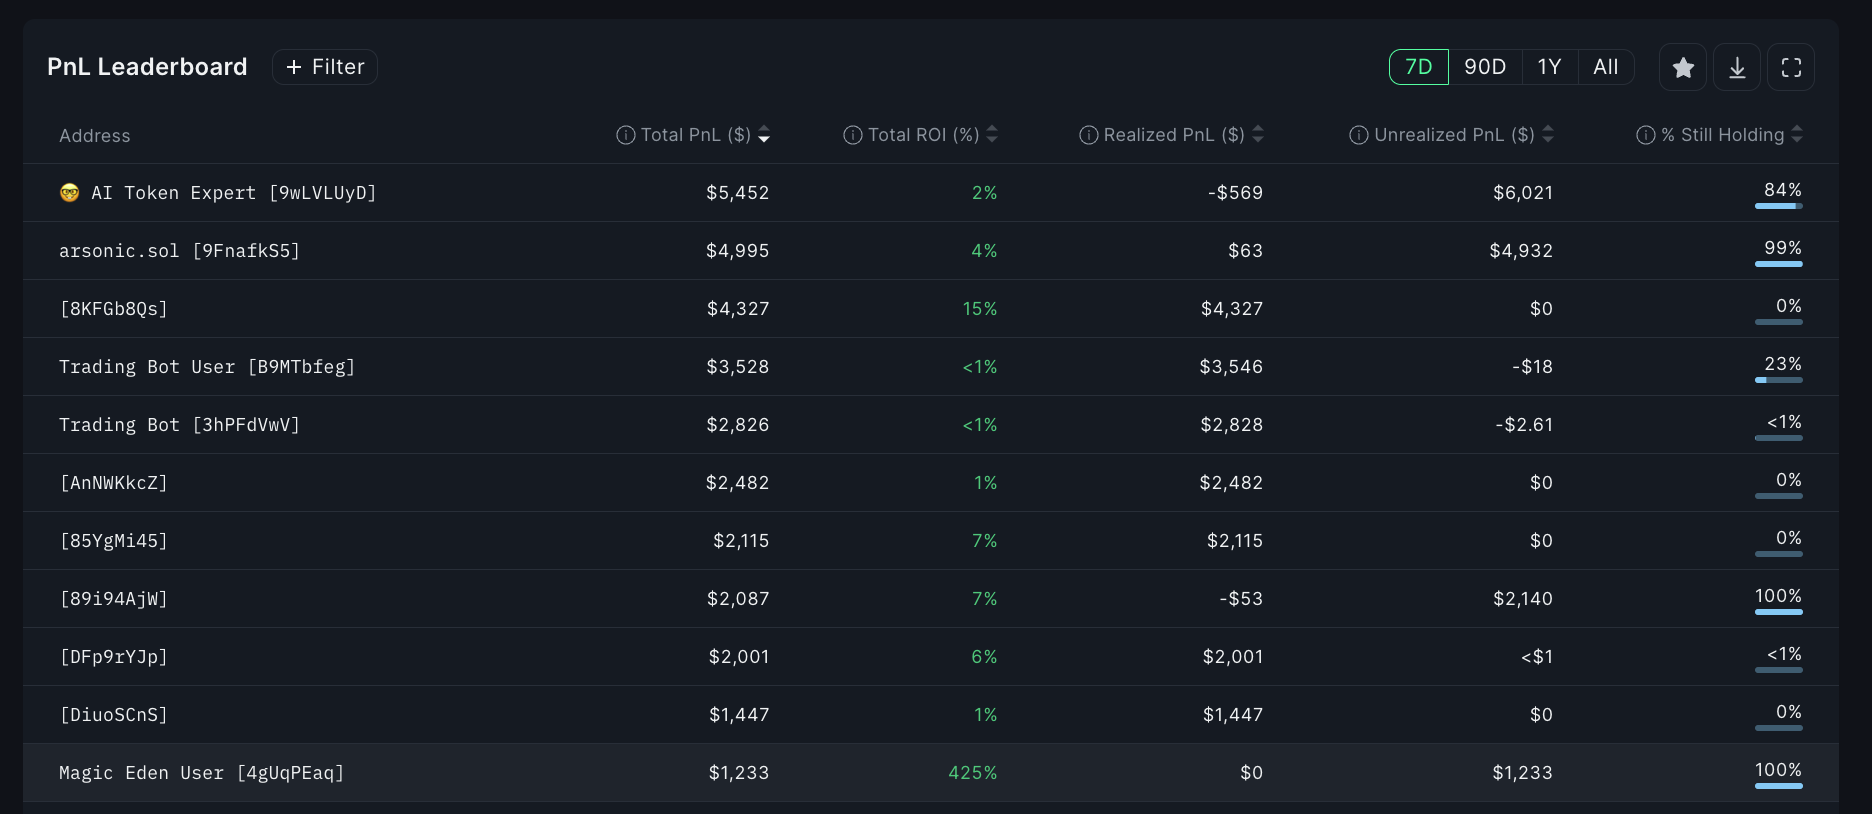
See the profits and losses for all the addresses in relation to the token you are observing, all for a given time frame (7d, 90d, 1Y, All-time)
Total PnL - The cumulative profit or loss, combining realized and unrealized PnL
Total ROI % - The overall return on investment, calculated by dividing the total PnL by the total cost of bought tokens.
Realized PnL - The profit or loss generated from sold tokens within the chosen timeframe, based on the difference between cost basis and selling price.
Unrealized PnL - The potential profit or loss on currently held tokens, based on thei difference between cost basis and current market price.
% Still Holding - The percentage of the highest percentage within the chosen timeframe that remains in the wallet.